Users and access privileges
CloudStudy supports three different types of users that correspond to three data access privileges. More specifically, we have:
- IT administrators (ITAs) that are responsible for the update and maintenance of the system and have access (edit, delete, or filter) to all data in the database,
- study administrators (SAs) that are typically in charge of an ongoing study and may access all data related to the specific study,
- participants in an ongoing study that may access only the data added by them.
Platform manager
Creating new platforms/ platform templates
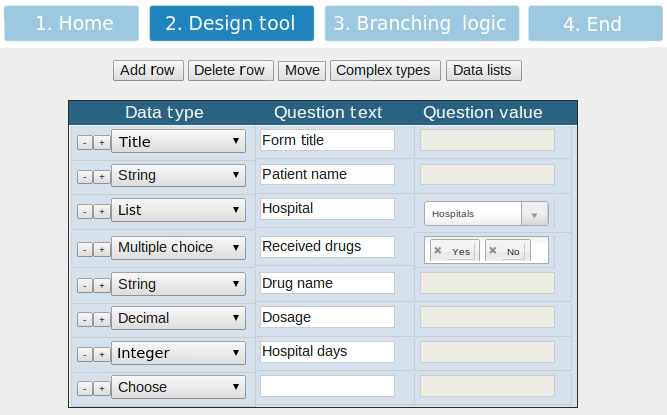
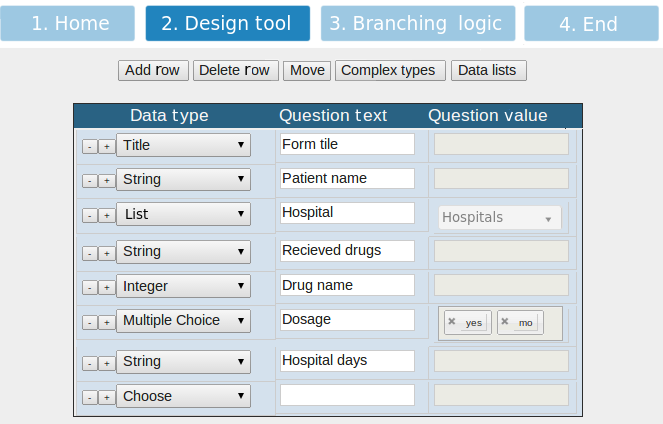
Platforms are typically created and administered by SAs users. More specifically, the SA is able to create a new platform/platform template by using the platform creation and editing tool. This tool guides the user to create a new platform/platform template in four steps. In step 1, the user specifies a name for the platform/platform template. In step 2, the SA is able to (a) design a new platform by inputting a platform name and defining a number of study questions and (b) rearrange, or delete questions through drag-and-drop actions. For each question, the SA specifies three key elements: the data type, the question text, and the question values. This process is performed with the design tool of Figure 1.
CloudStudy supports all standard data types such as:
- title (for introducing new questionnaire sections),
- string,
- integer,
- date,
- decimal,
- multiple choices,
- complex data types,
- Lists of Elements
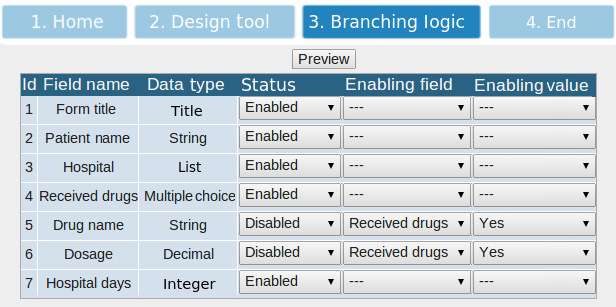
In step 3 the SA can specify the branching logic of questions. This functionality allows SA to specify the values in questions that are required to enable or disable following ones. For example in Figure 2, the SA specified that if the answer to the question Received drugs (Id = 4) is yes, the questions Drug name and Dosage (Id = 5 and Id = 6, respectively) should be enabled. And finally in step4 the user sets title and description of the platform.
Lists of Elements
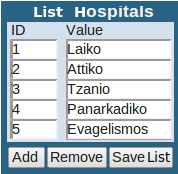
Lists (Figure 3) allow data input from dynamic, custom-made drop-down menus that the SA dynamically creates, stores, and edits during the platform design or maintenance. These lists may be shared across different studies of the same user and are used to ensure data consistency, enhance data integrity, and enforce validation of input. To define a new list, the SA specifies its unique name and defines its contents. Subsequently, when specifying a question, the SA sets the data type to list and selects one of the stored drop-down lists. For example in Figure 1, the third question specified is a user-defined list of hospitals participating in a study.
Complex datatypes
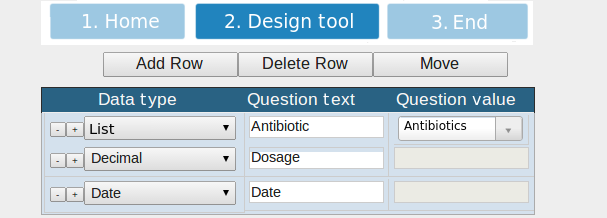
Complex datatypes (Figure 4) support medical operations that involve groups of recurring questions - as in treatment plans or therapeutic protocols which usually consist of a set of medicines with periodically recorded data (e.g., name, start/end dates, outcome). The advantages of creating complex data types include better data modeling, and thus richer query possibilities, and flexibility in the design of studies with complex/repeating medical processes.
Editing platforms/platform templates
Editing an existing platform/platform template in CloudStudy involves two different scenarios: (i) simple editing (Figure 5) that includes adding, deleting and modifying questions or their branching logic, and (ii) structural editing that relates to the modification of question order or data types. Such editing could affect data consistency or cause compatibility problems between the stored data and the new template and is thus limited to actions that do not cause such issues. For instance in Figure 5, the SA is not allowed to change Patient name to integer.
Study Manager
Administering and using a study
Once a study has been setup by creating a new platform, or re-using an existing platform template, the study administrator may use the study menu (Figure 6) to perform a number of administrative tasks, that include user management and role definition (Figure 7), data correction/input/filtering/export, and generation of usage/input statistics.
 Figure 6: Basic study menu.
Participants users may be created by the study administrator and their view of the data is limited to the access control policy defined. Users may add (Figure 9), edit, preview and delete (Figure 8) patient records and are able to temporarily save a questionnaire and resume data input at another time.
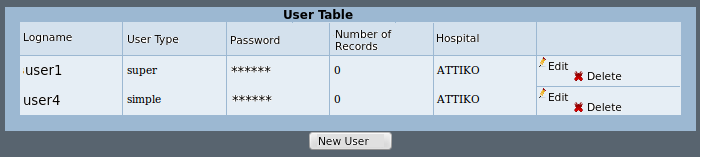 Figure 7: Managing study users.
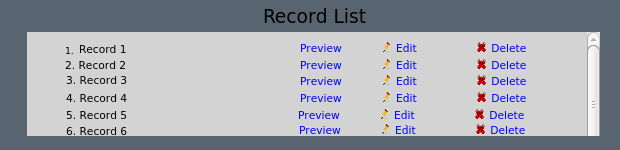 Figure 8: Managing records (preview/edit/delete).
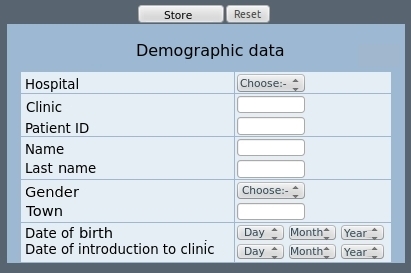 Figure 9: Creating a new patient record.
Filtering tool
SAs are able to extract information from a study, while participants may only extract information added by them. Such information may be retrieved and presented as (i) a set of tuples by resorting to the filtering tool, and (ii) a graph by resorting to the chart tool.
The filtering tool (Figure 10) uses a powerful yet easy-to-use query issuing mechanism that allows users to (i) filter and retrieve and (ii) export to a third-party application stored records by applying constraints with simple point-and-click interactions. Data filter and export involves a two-step process. In the first step the user defines the query output by checking the questions that will be used for data projection (i.e., data to be exported). In the second step, he applies one or more filtering conditions on the data. The filtering conditions are introduced by presenting all distinct values stored for a specific question and allowing the user to define the ones that satisfy the filtering criteria. In this way, he may define conjunctions and disjunctions both on the questions and on the stored data. The query result may then be exported in a spreadsheet, or presented as a list of tuples.
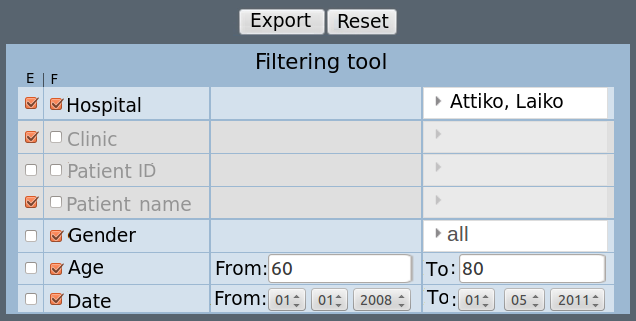 Figure 10: Filtering tool.
In Figure 10, the SA has selected to export the results for Hospitals, Clinics, and Patient names (notice the checked boxes in the first column) for all records that were input between 01/01/2008 and 01/05/2011 in Attiko or Laiko hospital and involve patients between 40 and 60 years of age (notice the specified constraints). The filtering tool is able to capture the complex data types described earlier, allowing the user to (i) set more than one filters for every complex data type and (ii) include constructs like concurrent episodes of a diagnosis or treatment. Examples of supported queries include:
Chart tool
The chart tool (Figure 11) may be used to extract and present information from stored data directly as a pie, column, bar, or donut chart (Figure 12). It supports the creation of single and multiple variable graphs depending on the constraints defined by the user.
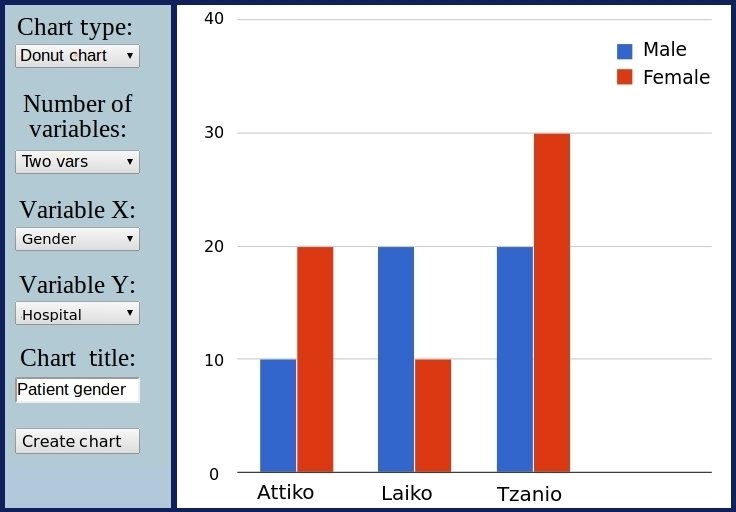 Figure 11: Chart tool.
In this way the user may dynamically create graphs for queries with a single variable like "how many patients in the database are male/female", but also for queries with multiple variables like "how many patients are male/female in each hospital that participates in the study" (shown in Figure 5).
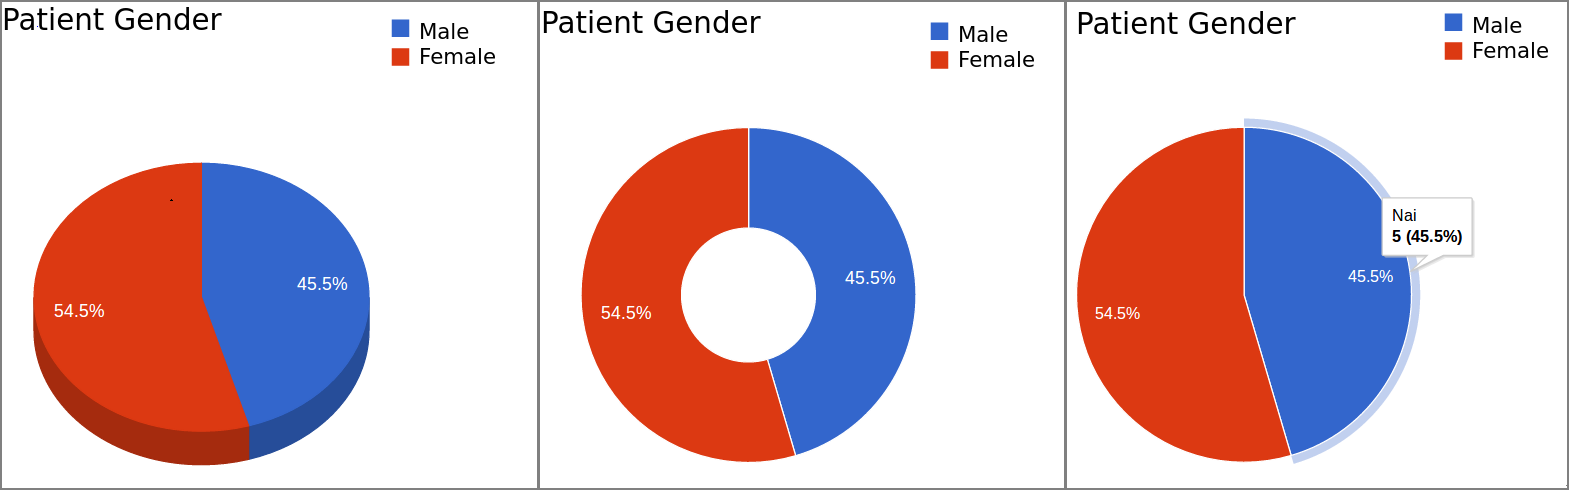
Figure 12: Types of charts.
Administering and using a study
Once a study has been setup by creating a new platform, or re-using an existing platform template, the study administrator may use the study menu (Figure 6) to perform a number of administrative tasks, that include user management and role definition (Figure 7), data correction/input/filtering/export, and generation of usage/input statistics.
Participants users may be created by the study administrator and their view of the data is limited to the access control policy defined. Users may add (Figure 9), edit, preview and delete (Figure 8) patient records and are able to temporarily save a questionnaire and resume data input at another time.
Filtering tool
SAs are able to extract information from a study, while participants may only extract information added by them. Such information may be retrieved and presented as (i) a set of tuples by resorting to the filtering tool, and (ii) a graph by resorting to the chart tool.
The filtering tool (Figure 10) uses a powerful yet easy-to-use query issuing mechanism that allows users to (i) filter and retrieve and (ii) export to a third-party application stored records by applying constraints with simple point-and-click interactions. Data filter and export involves a two-step process. In the first step the user defines the query output by checking the questions that will be used for data projection (i.e., data to be exported). In the second step, he applies one or more filtering conditions on the data. The filtering conditions are introduced by presenting all distinct values stored for a specific question and allowing the user to define the ones that satisfy the filtering criteria. In this way, he may define conjunctions and disjunctions both on the questions and on the stored data. The query result may then be exported in a spreadsheet, or presented as a list of tuples.
In Figure 10, the SA has selected to export the results for Hospitals, Clinics, and Patient names (notice the checked boxes in the first column) for all records that were input between 01/01/2008 and 01/05/2011 in Attiko or Laiko hospital and involve patients between 40 and 60 years of age (notice the specified constraints). The filtering tool is able to capture the complex data types described earlier, allowing the user to (i) set more than one filters for every complex data type and (ii) include constructs like concurrent episodes of a diagnosis or treatment. Examples of supported queries include:
- Show patients older than 40 years of age with temperature greater than 38, who were diagnosed with microorganisms (Pseudomonas and Candida). Notice that the names of the microorganisms are values already stored in the database.
- Show patients between 40 and 60 years of age, who live in (England or France or Greece), have been diagnosed with microorganisms ((Pseudomonas and Candida) or (Pseudomonas and Salmonella) or (Citrobacter)), have undertaken therapy with (Ampicillin or Cefotaxime), and had progress as the eventual outcome of their condition. Notice the application of Boolean operators both on the questions, and on the data stored for each question.
- Show patients who suffer from Massive hemoptysis, had an initial episode of Bacteremia and accepted a dose between 2 and 4mg of antibiotic Amikacin, and subsequently had a second episode of Bacteremia. Notice that the query is applied to a complex datatype (recurring episodes/treatments as described above).
Chart tool
The chart tool (Figure 11) may be used to extract and present information from stored data directly as a pie, column, bar, or donut chart (Figure 12). It supports the creation of single and multiple variable graphs depending on the constraints defined by the user.
In this way the user may dynamically create graphs for queries with a single variable like "how many patients in the database are male/female", but also for queries with multiple variables like "how many patients are male/female in each hospital that participates in the study" (shown in Figure 5).
| a) 3D pie chart | b) Donut chart | c) Pie chart |